Analysis: Westchester Covid-19 numbers currently heading in wrong direction

Analysis%3A+Westchester+Covid-19+numbers+currently+heading+in+wrong+direction

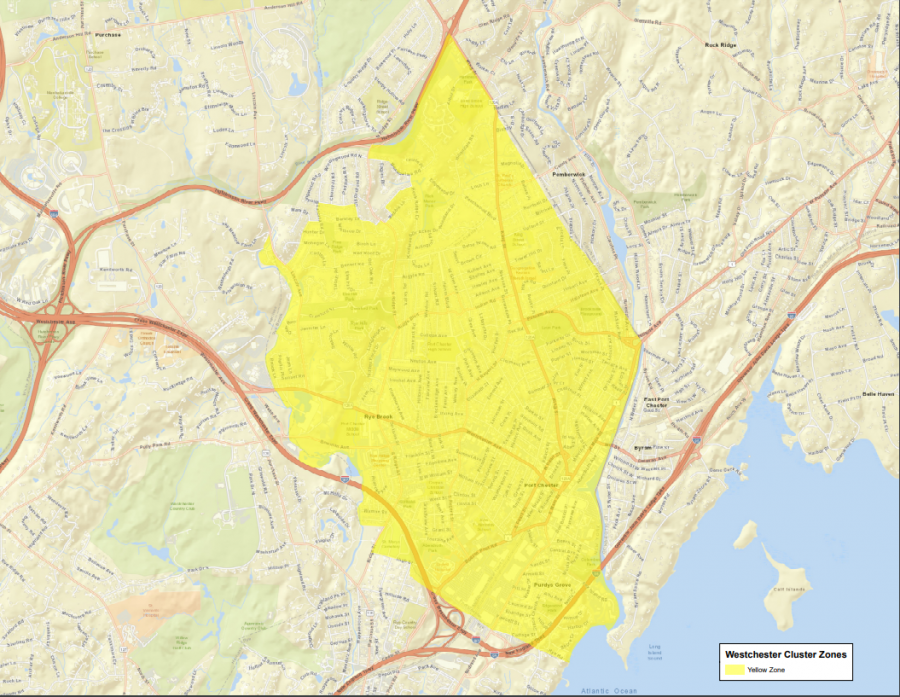
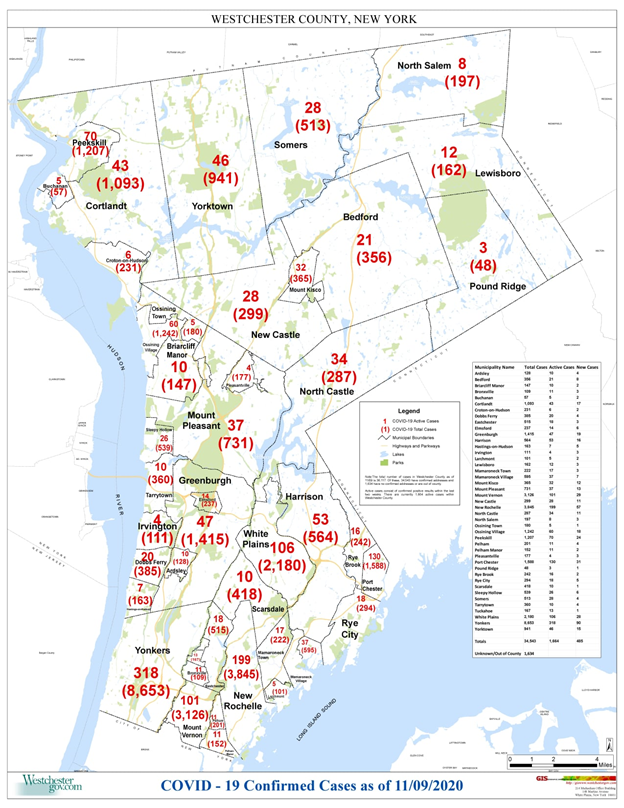
Let’s just focus on Westchester today, because on the face of it our numbers do not look encouraging. However, according to Gov. Andrew Cuomo, much of the increase appears to be in one micro-cluster centered around Port Chester.

On Monday, our single day testing-positive percentage for Westchester was at 4.17%, which is higher than we’ve been since March. The day before it was 3.41%.

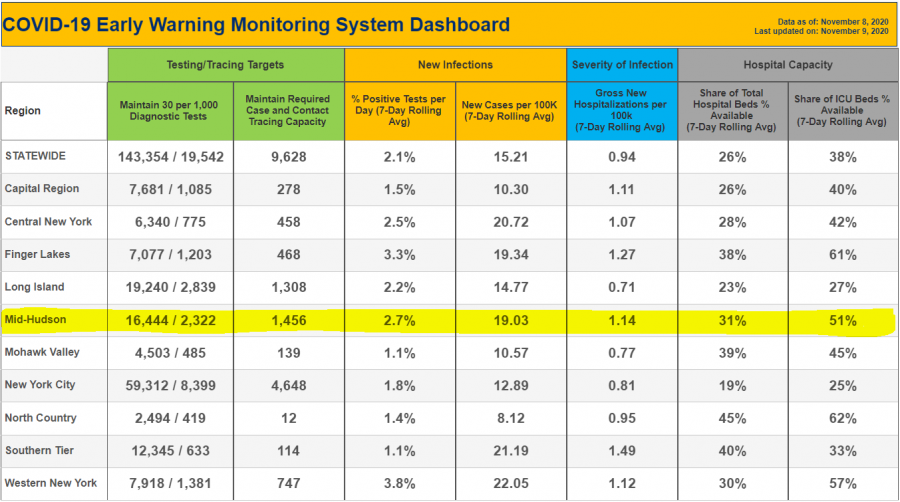
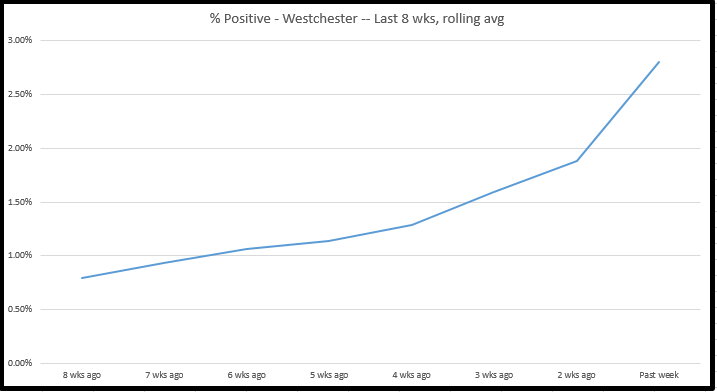
As you’ll recall, the state has a threshold at which it considers a region to be problematic (which can possibly include the requirement to close schools), and that threshold is 9% on a rolling seven-day average. While we are not there yet—our current seven-day average is 2.8%—we are heading in the wrong direction at the moment. (Note that there are different criteria for micro-clusters, discussed below, which seem to be more of the state’s focus at the moment.)

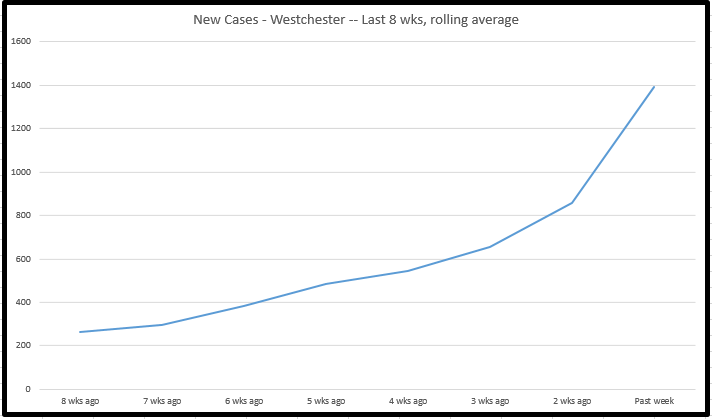
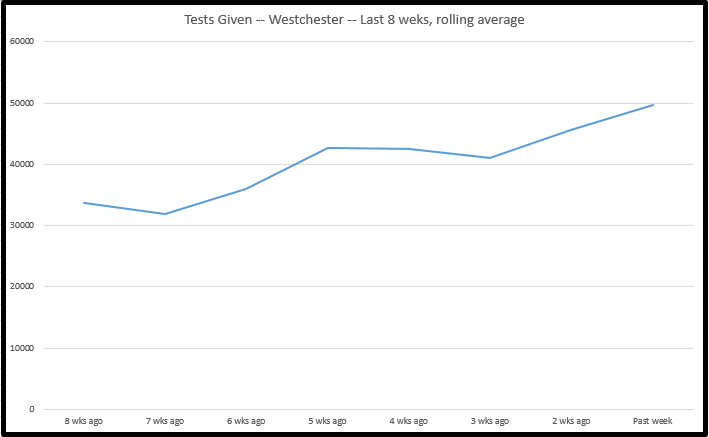
Eight weeks ago, Westchester had .8% positivity on a rolling seven-day average (see graph above). A month ago, we were at 1.3%. A week ago, it was 1.89%. But we have gone up by a percentage point, to 2.8%, in the space of a seven days. Similarly, eight weeks ago, we were seeing about 230 new cases per week in Westchester. Two weeks ago, it was about 650. This past seven days, we had almost 1,400 new cases. The number tested each week has risen some as well, but not at the same rate.

Here’s where we stand compared to other regions on the state’s dashboard (the numbers for the Mid-Hudson region look slightly different than Westchester because the region includes six other counties: Dutchess, Orange, Putnam, Rockland, Sullivan, Ulster).

However, as noted, we do have a micro-cluster in Westchester, around Port Chester, and that cluster may be driving some of the increase:

In fact, last Friday, Cuomo said, “Westchester is basically flat but for Port Chester, which is right on the Connecticut border, and Connecticut has taken serious, dramatic action because the numbers in Connecticut are not good.”

A community becomes a “yellow” zone (there are two additional levels, orange and red) like Port Chester if it has a seven-day rolling positivity rate over 2.5% for 10 straight days and also 10 or more new daily cases per 100,000 residents on a rolling seven-day average. On Monday, it was reported that Port Chester had 130 active cases:

With almost 1,400 new cases countywide over the past week, I’m not convinced that 130 new cases in Port Chester (if that’s all there are) really points to Westchester being “flat.” The county reported Monday that there are 1,664 active cases (the discrepancy between active and new cases arises because not all cases resolve quickly). So Port Chester represents about 7.8% of the active cases. With 30,000 residents, Port Chester is about 3.2% of the population of Westchester, so clearly it does have more than its fair share of cases. But even if you took all of its active cases out of the mix entirely, that still gives the rest of the county a positivity rate of 2.5%. Maybe there’s some aspect to the numbers I’m missing, but that does not seem flat with the prior week.

Given that we have seen more positive cases in Pelham (while still a very low number—22 active cases), it does seem safe to say the virus is spreading more widely now than it has since the spring. It will be terrific if efforts to slow the spread in Port Chester bring our county numbers back down, or at least keep them flat in the 2% to 3% range. But unless the big jump in positivity really has all been due to Port Chester, I do think we have to keep our guard up.

Lance Koonce is a Pelham resident. Though he is not a statistician or an epidemiologist, he has been keeping track of the state and local coronavirus data since early in the pandemic and publishes his analyses on Medium.